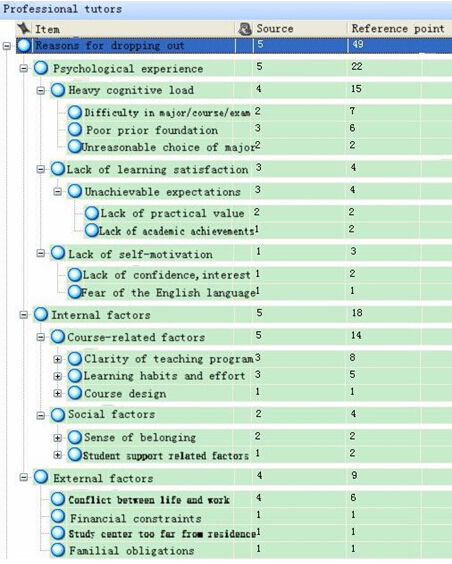
Figure 11 Dropout attribution code pattern for the first semester (diploma programme professional tutors)

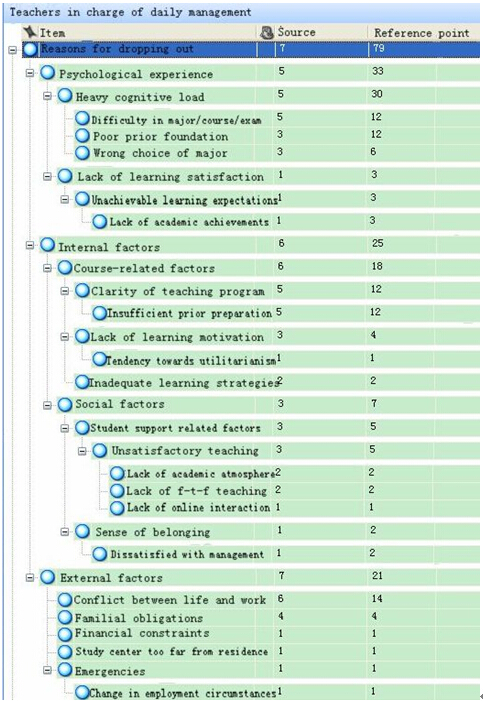
Figure 12 Dropout attribution code pattern for the first semester (teaching assistants)
B Different reasons for dropping out in the first and second semesters
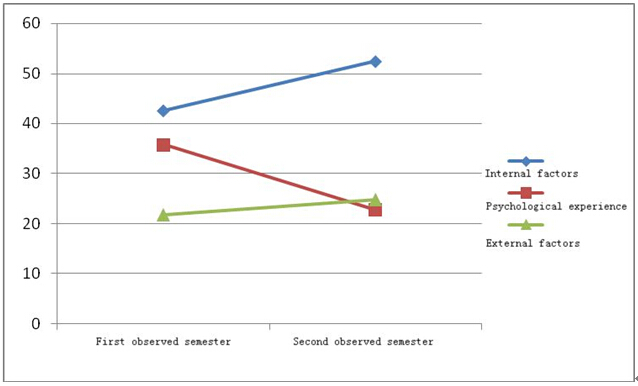
Table 6 compares the proportion reference points for the different reasons for dropping out during the two observed semesters. Figures 13 to 15 were formulated based on Table 6. In the first semester, the students themselves stated that internal factors, psychological experience and external factors (in order of importance) contributed to ODL dropout rates. The professional tutors and the teaching assistants agree that the factors contributing to dropout rates are, psychological experience, internal factors and external factors (in order of importance). In the second semester, the dropouts themselves felt more vulnerable to a lack of sense of belonging to university life, while the professional tutors and the teaching assistants put more stress on external factors and less emphasis on psychological experience.
Table 6 Proportion of reference points for individual reasons for dropping out during the two semesters observed
|
First observed semester |
Reasons for dropping out |
Proportion of reference points(%) |
Second observed semester |
Reasons for dropping out |
Proportion of reference points(%) |
|
Dropouts |
Internal factors |
42. 5 |
Dropouts |
Internal factors |
52.4 |
|
—Academic integration |
36.8 |
—Academic integration |
32.4 |
||
|
—Social integration |
5.7 |
—Social integration |
20 |
||
|
Psychological experience |
35.8 |
Psychological experience |
22.8 |
||
|
—Heavy cognitive load |
27.5 |
—Heavy cognitive load |
15.9 |
||
|
External factors |
21.8 |
External factors |
24.8 |
||
|
—Conflict between work and study |
13.0 |
—Conflict between work and study |
15.9 |
||
|
Professional tutors |
Internal factors |
36.7 |
Professional tutors |
Internal factors |
36. 4 |
|
—Academic integration |
28.6 |
—Academic integration |
18. 2 |
||
|
—Social integration |
8.16 |
—Social integration |
18. 2 |
||
|
Psychological experience |
44.9 |
Psychological experience |
27. 3 |
||
|
—Heavy cognitive load |
30.6 |
—Heavy cognitive load |
18. 2 |
||
|
External factors |
18.4 |
External factors |
36. 4 |
||
|
—Conflict between work and study |
12.2 |
—Conflict between work and study |
18. 2 |
||
|
Teachers in charge of daily management |
Internal factors |
31.6 |
Teachers in charge of daily management |
Internal factors |
0 |
|
—Academic integration |
22.8 |
—Academic integration |
0 |
||
|
—Social integration |
8. 9 |
—Social integration |
0 |
||
|
Psychological experience |
41.8 |
Psychological experience |
0 |
||
|
—Heavy cognitive load |
38.0 |
—Heavy cognitive load |
0 |
||
|
External factors |
26.6 |
External factors |
100 |
||
|
—Conflict between work and study |
17.7 |
—Conflict between work and study |
33.3 |
Proportion of reference point=individual discontinuation reason reference point/entire discontinuation reason reference point

Figure 13 Comparison of reasons for dropping out during the two semesters observed (dropouts)